Source code visualisation for my projects

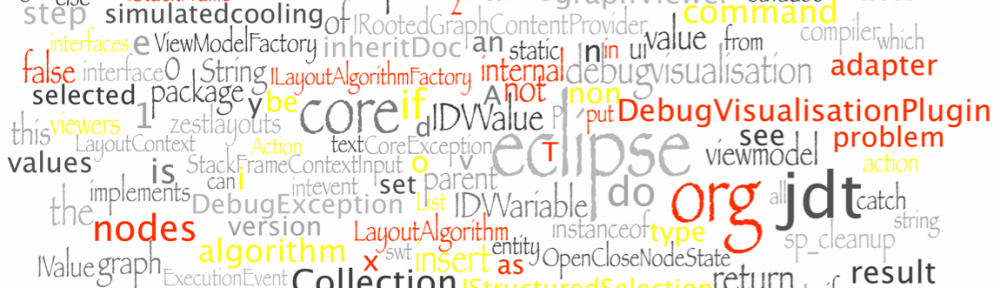
Today I read the announcement of SourceCloud, a new Zest/Cloudio-based visualization for source code. As I like cool visualizations, I tried it out on the open projects I am participating in.At first I created the cloud for the source code of the Debug Visualisation project. Globally it consists of about half Eclipse debugger/UI and Java keywords – as this is quite a small project (about 4 kLOC), this is somewhat expected with 200 words.

SourceCloud of the Debug Visualisation Project

However, it is interesting, that the strings ‘end_of_line‘ and ‘sp_cleanup‘ found their way in. Luckily, only a few one-character names and numbers are present, meaning, we managed to created longer variable names…

The cloud of the VIATRA2 model transformation framework is more interesting: it is a much larger codebase, developed for several year by around a dozen people. Because of the size I generated the cloud using 300 words, but almost no Java keywords found their way into the graph.

SourceCloud of the VIATRA2 framework

However, the mandatory comment parts did, e.g. nbsp or the names of some creators. A lot of EMF-specific keywords are also present. They are present because we have quite a large EMF metamodel that provides several hundred generated Java files.

At last, but not least I also checked the cloud of the EMF-IncQuery project. This is smaller, then the VIATRA2 project, but larger then the Debug Visualisation. Additionally, it has a shorter history, but with several key committers.

SourceCloud of the EMF-IncQuery project

My personal favorite is this diagram, as it shows a lot of nice things: e.g. four digit numbers in large quantities (magic numbers FTW) or the absolute champion string: ‘HUKfyM7ahfg‘. All of them are present in the Ecore Diagram of the defined metamodel (the meaningless string 152 times as a postfix of an identifier 🙂 ). At least, I learned something about the internal model representation of GMF.

And how do your projects look like?

New features in the Debug Visualisation plug-in

After a month, some bugs from the Debug Visualisation version 0.8.0 have been fixed. Most notably, the incorrect trimming of long titles, and a case, where arcs were incorrectly removed from the graph.

Two minor new features were also introduced: it is possible to turn off name trimming, and the values of variables is now displayed as a hover.

I created a screencast to show these new features (and also some other, as the last screencast was created over a year ago.

(If the embedded video does not show in your feed reader, you can watch it on YouTube.)

Here it is: Debug Visualisation 0.8.0

After several months of (more or less) active development we are proud to introduce our latest and greatest release of the Debug Visualisation Eclipse plug-in.

The changes are three-folds in this release: first, a view model is defined for the visualisation. This one is only interesting for us, developers, as it enables us to store calculated data together with the referenced variable or value, making it easier to produce new features in later releases.

The other changes are more visible: we integrated our approach with the debug platform: it is possible to add variables to the visualisation by using the context menu of the Variables View. For similar reasons, our custom filter implementation was replaced with the platform-defined logical structures. This means, more specific filters are available, and it is possible (at least for Java) for the user to define more in the corresponding Eclipse preferences page (Java/Debug/Logical Structures).

These stuctures provide a way to removed some (possibly) irrelevant variables from the visualisation, as it is possible to define on a per-type basis the relevant structure (and it is also possible to define multiple structures for the same type, allowing the user to choose between them).

These structures can be selected from the context menu of the values in the Visualisation view. Such a possible selection is depicted on the following screenshot:

In the context menu it is possible to select both the Raw structure and the Array structure.
Logical structure selection for an ArrayList

Warning: the logical structure selection is (and possibly will) not synchronized with the variables view.

Finally, some internal changes were made to ensure, the plug-in is easier to use, such as the ability to define custom orderings for some layouts.

For a list of all fixed issues visit our issue tracker.

The new release can be downloaded from our update site right now (http://eclipse.cubussapiens.hu), and hopefully shortly also from the Eclipse Marketplace.

Update: Detailed project information is available from our Google Code project page.

Update2: The new release is available (and installable) from the Eclipse Marketplace.

New service release: 0.7.2

I’m proud to announce that after a long time, we finally managed to throw out a new release. I’ve managed to improve the core functionality therefore this release contains a significant advance in overall performance.

Also, Stampie managed to fix a long-awaited feature, the two-way synchronization with the variables view.

In the future, we plan to redesign the use-cases of the tool. Currently, we’re in an experimental phase, which means we do not know how we want it to work.